http://ggplot2.tidyverse.org/reference/
theme_set(theme_light())


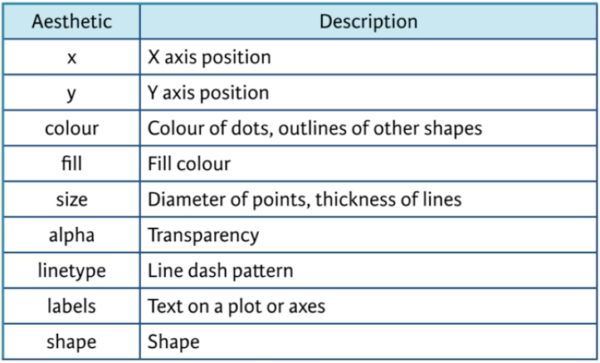
Variables in a data frame are mapped to aesthetics in aes(). (e.g. aes(col = cyl)) within ggplot(). Visual elements are set by attributes in specific geom layers (geom_point(col = "red")).

- geom_bar(aes(width = prop), stat = “identity”, fill = “skyblue”)
- ggplot(adult, aes (x = SRAGE_P, fill= factor(RBMI))) +
geom_histogram(aes(y = ..count../sum(..count..)), binwidth = 1, position = “fill”)


- cars %>% ggplot(aes(x = 1, y = msrp)) + geom_boxplot()
- geom_smooth(aes(color = factor), se = F, lwd = 2)
- geom_smooth(method = ‘lm’, fullrange = T)
- geom_smooth(method = “glm”, se = FALSE, method.args = list(family = “binomial”))
- ‘lm’ = linear model
- ‘glm’ = Generalized Linear Models
- ‘loess’ = LOESS
- span = 0.7
- geom = ‘path’
- aes(group = 1, col =’All’) model on all points despite col


- stat_summary(fun.data = mean_sdl, fun.args = list(mult = 1), position = posn.d)
- stat_summary(fun.data = mean_cl_normal, position = posn.d)
- fun.y = mean
- geom = ‘bar’, ‘errorbar’, ‘ribbon’
- fun.args =
- poition = ‘dodge’

- + scale_fill_manual(values=c(“#999999”, “#E69F00”, “#56B4E9”))
- + scale_color_manual(values=c(“#999999”, “#E69F00”, “#56B4E9”))

- coord_trans(x = “log10”, y = “log10”)
- ggplot(mtcars, aes(1, fill = cyl)) + geom_bar() + coord_polar(theta = “y”)
- ggplot(mtcars, aes(1, fill = cyl)) + geom_bar(width = 1) + coord_polar()
- facet_grid(z ~ ., scale = “free_y”, space = “free_y”) leaves out rows with no data.
- facet_grid(z~w, labeller = label_both)

- theme(legend.position)
- theme(legend.direction)
- Theme Layers:
- text: element_text()
- line: element_line()
- rectangle: element_rect()

- + theme(plot.background = element_rect(fill = ‘green’))
- + theme(plot.background = element_rect(fill = ‘green’, color = ‘black’, size = 3))
- + theme(plot.background = element_rect(fill = ‘green’, color = ‘black’, size = 3)) + theme(panel.background = element_blank(), legend.key = element_blank(), legend.background=element_blank(), strip.background = element_blank())
- + theme(panel.grid = element_blank(), axis.line = element_line(color = “black”),
axis.ticks = element_line(color = “black”)) - + theme(strip.text = element_text(size = 16, color = myRed),
axis.title.y = element_text(color = ‘red’, hjust = 0, face = “italic”),
axis.title.x = element_text(color = ‘red’, hjust = 0, face = “italic”),
axis.text = element_text(color = “black”)) - + theme(axis.text.x = element_text(angle = 45, hjust = 1, vjust = 0.1))
- theme_update(): updates general theme,
- theme_set()
library(grid) increase spacing between facets
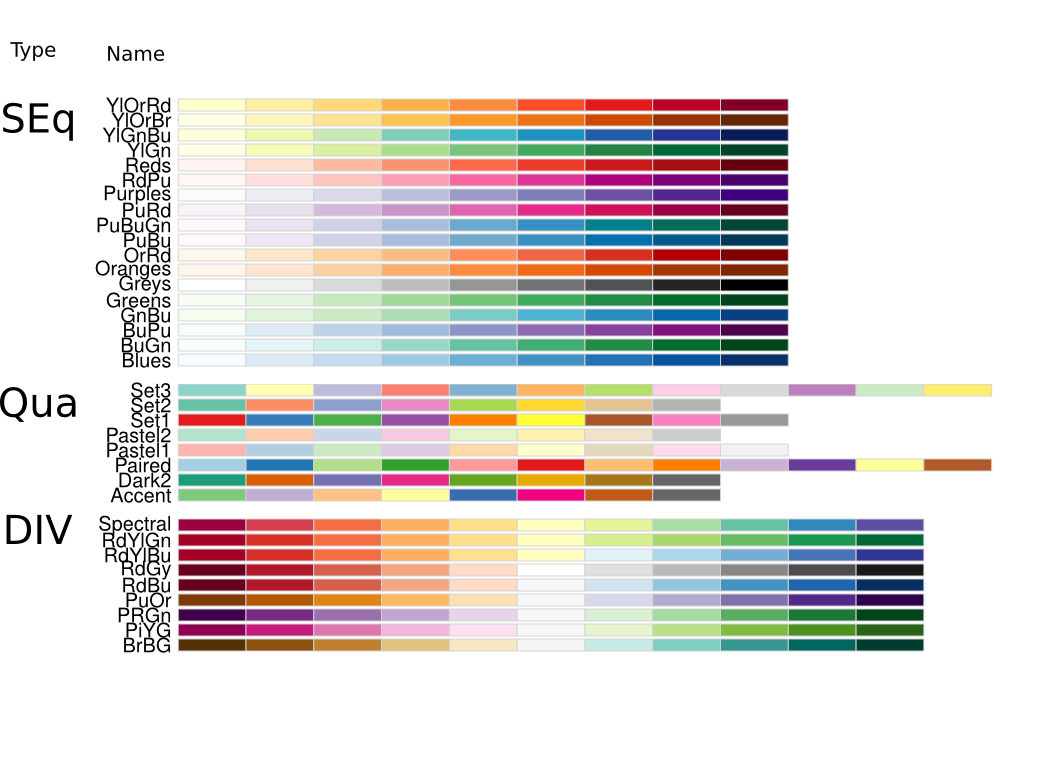
brewer.pal()
+ scale_fill_brewer(palette = “OrRd”)
p5 = ggplot(lastbalans, aes(time)) + geom_bar() + xlim(c(0.3,2.5)) + ggtitle(“totalt”)
p6 = ggplot(appdf, aes(time)) + geom_bar() + xlim(c(6.5,7.5)) + ggtitle(“totalt”)
grid.arrange(p3, p4, ncol=2)