K-means
Clustering: Find the underlying structure, summarize and group unlabeled dataset. Clustering means grouping of objects based of the information found in the data describing the objects or their relationship. Objects in one group should be similar to each other but different from objects in another group.set.
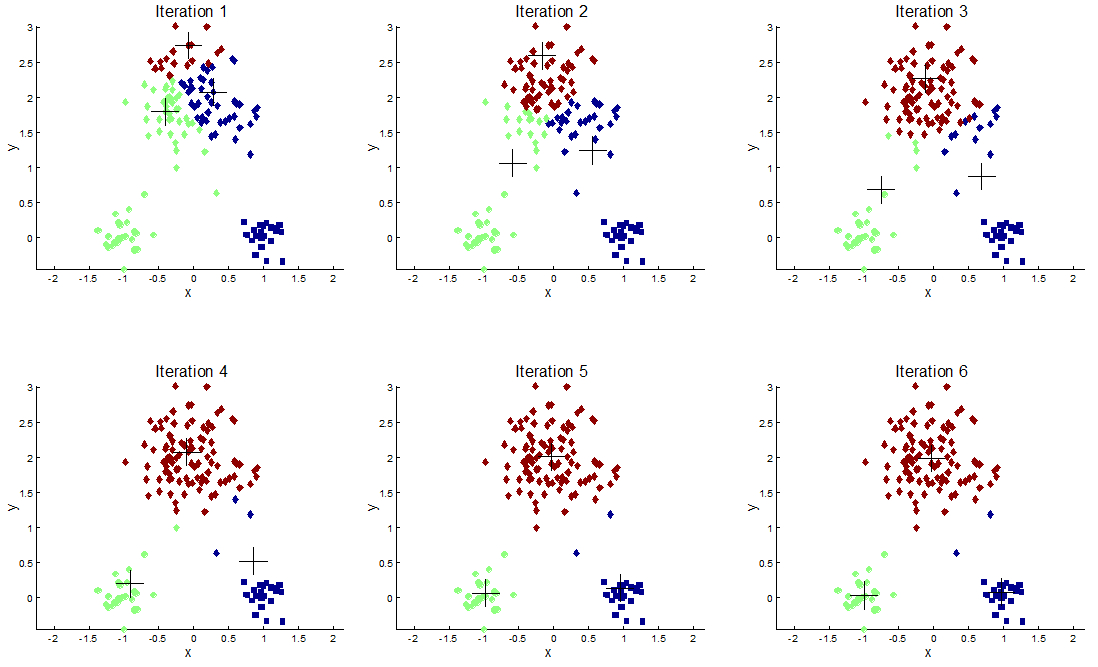
K-means is a clustering algorithm that tries to partition a set of points into K sets (clusters) such that points in different clusters are dissimilar while points within a cluster are similar. It is unsupervised because the points have no external classification.
Every centroid tries to place itself in the heart of likeshaped points but as far as possible from the other centroids and their point.
- K-menas is Exclusive clustering, an item belongs exclusively to one cluster.
- All sort of segmentation
- Classifying handwritten digits
- Can’t have missing values
- Not easy to come up with metrics for measuring results (domain-specific)
K-means clustering


- Toy story: (0, 0, 0, 0, 1, 1, 0, 1, 0, 1, 0, 1, 1, 1, 1, 0, 0, 0)
- Batman : (0, 1, 1, 0, 0, 1, 0, 1, 1, 1, 1, 0, 0, 0, 0, 1, 1, 0)
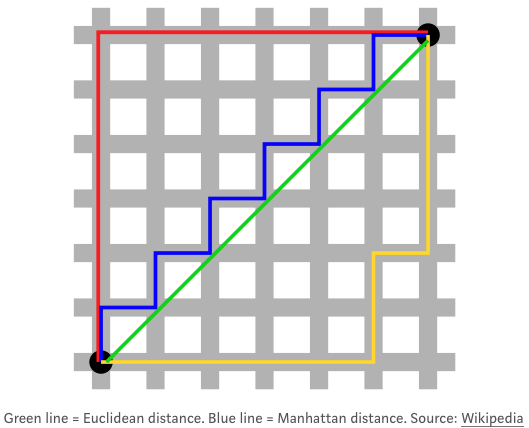
- euclidean distance: sqrt((0-0)^2 + (0-1)^2 + (0-1)^2…)
- Other popular distance metrics:
- Manhattan Distance: sum of absolute values instead of squares
- Maximum Coordinate Distance: only consider measurement for which data points devite the most
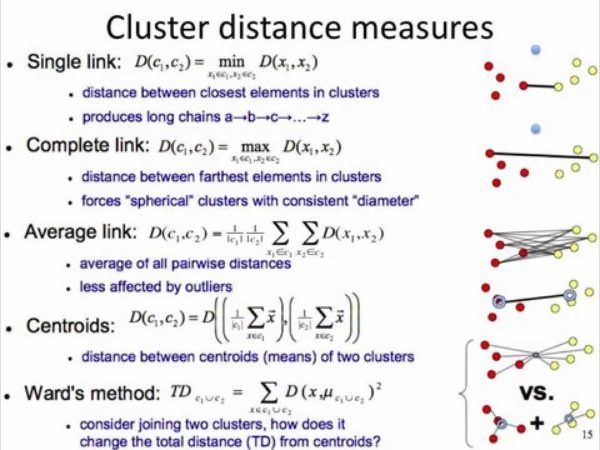
- Distance between clusters:
- Minimum Distance: distance between clusters = dist between points that are closest
- Maximum Distance: distance between clusters = dist between points that are the farthest
- Centroid Distance: dist between centroids (center, average) of clusters
Must Normalize data in clustering. Otherwise the variables with higher values like revenue doesn’t dominate the model, compared to other lower values like years.
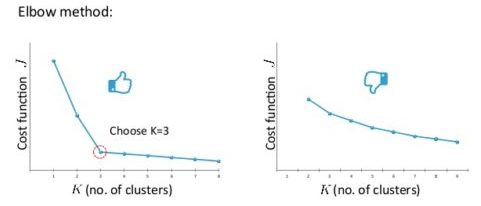
Choosing the value of K:
R:
library()
fit <-kmeans(data, k=5)
summary(fit)
fit$cluster
distances = dist(movies[2:20], method = “euclidean”)
- method = ward.D cares about distances between clusters using centroind dist and also variance in each of the clusters
- method = “euclidean”
clusterGroups = cutree(clusterMovies, k = 10)
tapply(movies$Action, clusterGroups, mean)
tapply(movies$Romance, clusterGroups, mean)
colMeans(subset(movies[2:20], clusterGroups == 1))
colMeans(subset(movies[2:20], clusterGroups == 2))
subset(movies, Title==”Men in Black (1997)”)
clusterGroups[257]
cluster2 = subset(movies, clusterGroups==2)
cluster2$Title[1:20]
spl = split(movies[2:20], clusterGroups)
spl[[1]] #is the same as subset(movies[2:20], clusterGroups == 1)
colMeans(spl[[1]]) #will output the centroid of cluster 1.
#But an even easier approach uses the lapply function. The following command
#will output the cluster centroids for all clusters:
lapply(spl, colMeans)
#The lapply function runs the second argument (colMeans) on each element of
#the first argument (each cluster subset in spl). So instead of using 19 tapply
#commands, or 10 colMeans commands, we can output our centroids with just two
#commands: one to define spl, and then the lapply command.